Orders Dashboard

Understand your orders, which products are HOT and which are NOT.

Orders Dashboard

Understand your orders, which products are HOT and which are NOT.

precalculated-for-you

PreCalculated For you

Our Profit page presents unique BI solutions that provides a summary of historical, and present data

understand-the-trend

Understand The Trend

All the data and account analytics you’ll see are automatically compared to the corresponding time period. Reveling important information.

stay-updated

Stay Updated

We present you not only near real time detailed information but also the most accurate profit and loss calculations.

+54%

Positive Feedbacks

+21%

Rating

+17%

Returning Customers

+54%

Positive Feedbacks

+21%

Rating

+17%

Returning Customers

Lets talk orders....

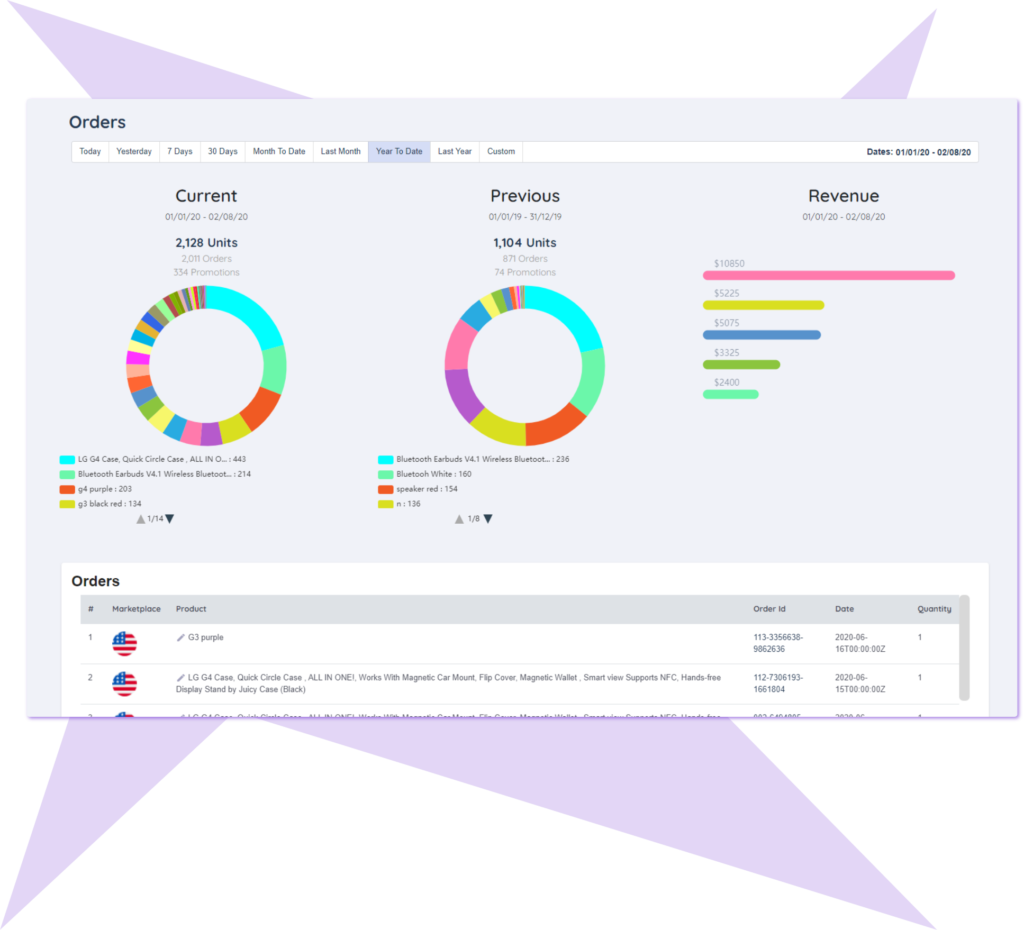
We know that sometimes all you need is a quick, simple and clean look of your orders and products performance. This page offers exactly that.

See which products are in demand and which full short!

Our tow pie chart shows the products bifurcation in two corresponding time periods. so you can always compare performance and stay on top of your game.

the-fab-five

The Fab Five!

Ever woke up wandering “What’s my five best sellers ?”

Well wonder no more !

We tracked down your TOP FIVE best sellers, but that’s not all, We also show you what is your revenue value for each of your fab five so you can be sure they really are as fab as they seem!

Learn About The Fees

Fees.. fees… fees.. they can really snick up on you. we made sure you are never caught off guard !

Our Orders pie chart pop ups hold more then just the boring old order’s details.

The Pie chart’s pop ups hold valuable fees information. See exactly what fees and more importantly how much fees you were charged on each and every order.

Try Quantify Ninja for Your Amazon Business

14 day free trial | No credit card needed

Quantify Ninja